


 162 / 220

臺灣農藥科學 第
1
期
160
chewers
在展開葉上的分布雖屬聚集型,但
其
s
2
/m
值明顯較
sucking-mites
及
sucking-
insects
為低。施藥區未展開葉上
sucking-
mites
的擁擠度明顯較不施藥區為高,在
展開葉上則互有消長,仍以
sucking-mites
的擁擠度表現稍高;
sucking-insects
在花
上的平均擁擠度則高於
sucking-mites
。從
index of patchiness
的變化圖來看,施藥區
sucking-mites
與
sucking-insects
的 聚 集 程
度相仿,不施藥區
sucking-mites
則稍大於
sucking-insects (
圖十二、十三、十四
)
。
不施藥區
sucking-insects
、
sucking-mites
及
chewers 3
種共食群以
Iwao
’
s m*-m regres-
sion
及
Taylor
’
s power law 2
種方法分析其空
間分布的型式,列於表四。
sucking-insects
及
sucking-mites
在未開展葉上的
β
值分別
為
2.307
及
1.311
,經
Student
’
s
t
-test (
α
= 0.5)
檢定結果與
β
= 1
無顯著差異,故判定其在
未展開葉上呈逢機型分布,
sucking-insects
在展開葉及花上其
β
值均大於
1
,故為聚集
型分布。
sucking-mites
在展開葉上
β
值為
4.18
,但經
t
-test
檢定與
β
= 1
無顯著差異,
乃因發生密度變異大所致,仍判定呈逢機
型分布,但在花上則呈聚集型分布;
chew-
ers
在展開葉上呈現聚集型分布。以
Taylor
’
s
power law
的分析結果顯示,
sucking-insects
在未展開葉、展開葉及花上的分布屬聚集
型分布,
sucking-mites
僅在花上屬聚集型分
布,在未展開葉及展開葉均呈逢機型分布;
chewers
在展開葉上的分析結果與
Iwao
’
s
m*-m regression
的分析結果相同,屬聚集型
分布。
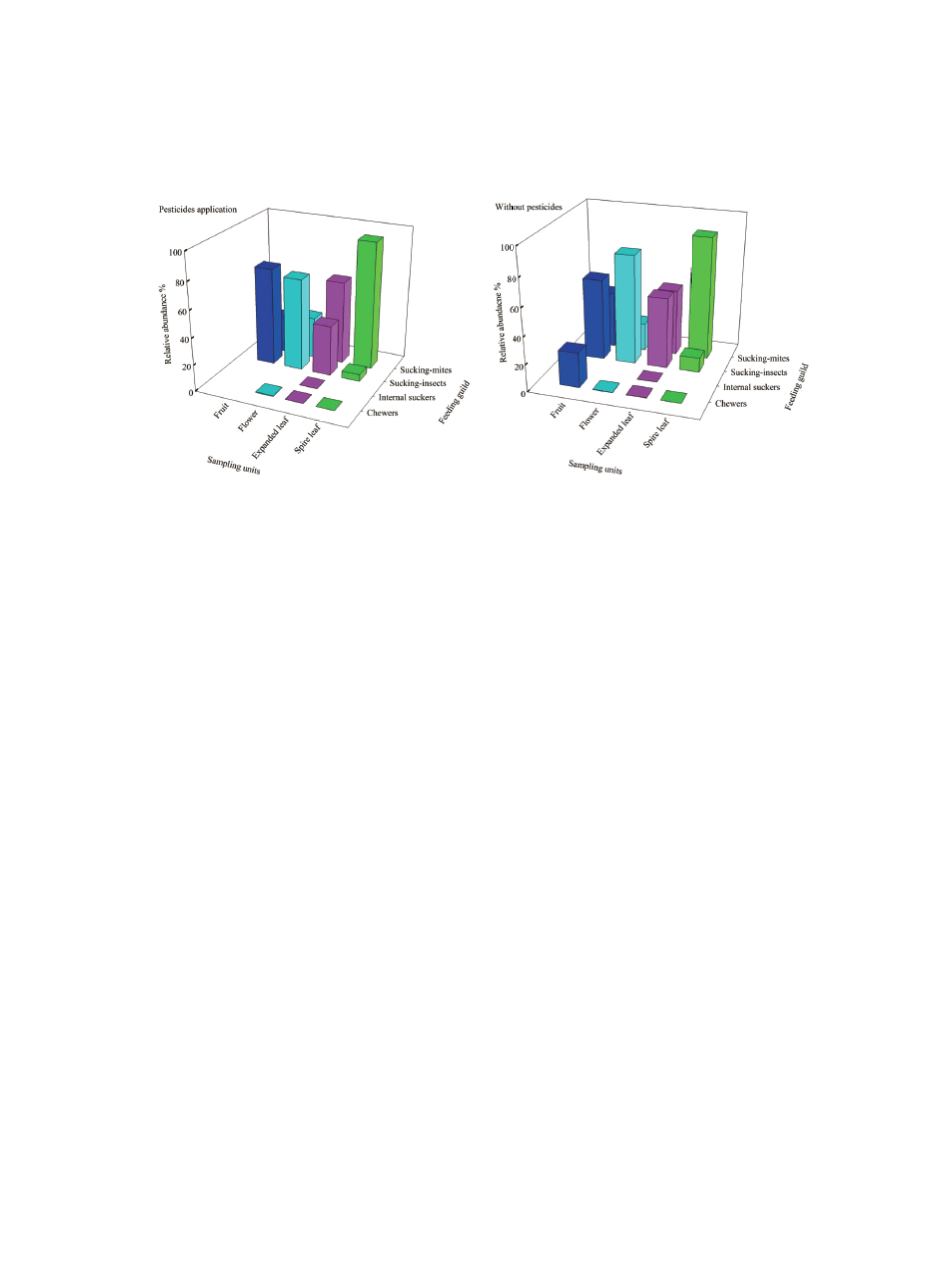
B
A
圖八、臺中市大里茄園施藥區
(A)
及不施藥區
(B)
植食性種類不同共食群在茄株不同部位
上之相對豐量。
Fig. 8.
Relative abundance of different herbivorous feeding guilds on different parts of eggplant in
plots that (A) had been and (B) had not been treated with pesticides.